

The most useful insulin resistance tests are fasting insulin paired with fasting glucose to calculate HOMA-IR, an oral glucose tolerance test (OGTT) with insulin, a C-peptide test, and the routine glucose markers your doctor probably already orders: A1C and fasting plasma glucose (FPG). Triglyceride-to-HDL ratio adds supporting evidence but works best alongside the others, not alone. If you suspect insulin resistance, ask your clinician specifically for a fasting insulin test (most standard panels skip it) and a C-peptide if there’s any question about how much insulin your pancreas is actually producing. You can also order a targeted panel directly.
Here’s how to act on that today:
- Request fasting insulin and fasting glucose, drawn together, after 8 to 12 hours of fasting.
- Ask for C-peptide if you have a strong family history of diabetes or unclear insulin status.
- Bring your results to a clinician or health coach who can calculate HOMA-IR and put the numbers in context.
Pro Tip: Write down your last meal time and any medications before your blood draw. A four-hour “fast” that was really a late-night snack will skew your fasting insulin and quietly wreck your HOMA-IR score.
| Point | Details |
|---|---|
| Best starting tests | Fasting insulin plus fasting glucose gives you HOMA-IR, the most practical early-warning combination. |
| Standard panels often miss it | Most routine blood work checks A1C and glucose but skips fasting insulin unless you ask. |
| Healthspan Holistic option | The Metabolic Panel and Peptide Baseline Lab Panel both include markers relevant to insulin resistance screening. |
Key Takeaways
Testing for insulin resistance works best as a combination approach: fasting insulin and fasting glucose calculate HOMA-IR, while C-peptide and glucose markers fill in the rest of the picture.
| Point | Details |
|---|---|
| Fasting insulin is the gap | Most routine panels skip it; request it specifically or order a panel that includes it. |
| HOMA-IR needs context | A single calculated score under 1.0 is optimal, but 2.0-3.0+ warrants follow-up, not panic. |
| A1C and FPG catch problems late | These standard tests only flag issues after glucose has already been elevated for weeks. |
| C-peptide clarifies pancreatic output | Useful when insulin numbers alone don’t explain the clinical picture. |
| Healthspan Holistic offers direct options | The Metabolic Panel and Peptide Baseline Lab Panel both cover markers relevant to insulin resistance. |
Table of Contents
- Why Clinicians and Researchers Measure Insulin Resistance
- What the Common Insulin Resistance Tests Actually Measure
- How to Interpret Your Insulin Resistance Test Results
- Who Should Get Tested and When
- How to Get Tested and What Comes Next
- Order the Right Panel Without Guessing What to Ask For
- Sources
- FAQ
Why Clinicians and Researchers Measure Insulin Resistance
Insulin resistance develops years before blood sugar numbers budge. Your pancreas compensates by pumping out more insulin to keep glucose in a normal range, and that compensation can mask the problem on a standard glucose test for a decade or more. Catching that compensation early is the entire point of testing.
The research gold standard, the hyperinsulinemic-euglycemic clamp, measures insulin sensitivity directly by infusing insulin and glucose while tracking how much glucose the body needs to maintain stable blood sugar. It’s precise, but it takes hours, requires IV access and continuous monitoring, and costs far more than routine care can justify. That’s why the clamp method stays confined to research settings rather than your doctor’s office.
Clinicians instead lean on surrogate markers that approximate what the clamp measures, using a single blood draw. What they’re really trying to learn from these tests:
- Whether your pancreas is compensating (elevated fasting insulin with normal glucose)
- Your risk of progressing to type 2 diabetes over the next several years
- Whether you meet criteria for metabolic syndrome alongside blood pressure and lipid markers
Guidance from bodies like the NIDDK, the CDC, and major academic medical centers still centers on glucose-based screening. Insulin-focused testing tends to be something you have to request rather than something ordered automatically.
What the Common Insulin Resistance Tests Actually Measure
Each test in this category answers a slightly different question, and knowing which one answers your question saves you money and confusion.
A1C measures average blood sugar over roughly three months by looking at how much glucose has attached to your hemoglobin. It requires no fasting, which makes it convenient, but it only catches problems after glucose has already been running high for weeks. It won’t flag early insulin resistance, when your pancreas is still successfully compensating.
Fasting plasma glucose (FPG) is a single snapshot of blood sugar after an 8 to 12 hour fast. Fast, cheap, and covered by nearly every insurance plan, but like A1C, it can look perfectly normal while insulin is quietly climbing behind the scenes.
Fasting insulin measures the actual hormone level in your blood after fasting. This is the test most standard panels leave out, and it’s the one that flags insulin resistance earliest, sometimes years before A1C moves. High fasting insulin levels alongside normal glucose is the classic early signature of a pancreas working overtime.
HOMA-IR isn’t a separate blood draw. It’s a calculation using your fasting insulin and fasting glucose together:
- Multiply fasting insulin (μU/mL) by fasting glucose (mg/dL).
- Divide that number by 405 for U.S. units, or by 22.5 if glucose is measured in mmol/L.
- Compare the result to your lab’s reference range and your clinician’s interpretation.
Worked example: fasting insulin of 12 μU/mL and fasting glucose of 95 mg/dL gives you (12 × 95) / 405 = 2.81. That number alone doesn’t diagnose anything, but it’s a data point worth tracking over time. The formula itself is detailed on MDCalc, including unit variants for international labs.
OGTT with insulin goes further: you drink a glucose solution, then get blood drawn at intervals (often fasting, 1 hour, and 2 hours) to see how both glucose and insulin respond dynamically. It’s more sensitive than a single fasting draw because it reveals how well your body handles a glucose load in real time, not just at rest.
C-peptide measures a byproduct released in equal amounts to insulin during production. Because it’s unaffected by injected insulin and has a longer half-life, it’s especially useful for distinguishing how much insulin your own pancreas is making versus what’s coming from medication, with typical reference ranges around 0.3 to 3.3 ng/mL depending on the lab.
Lipid-based markers, particularly the triglyceride-to-HDL ratio, offer a cheap supplementary clue. A ratio above 3.0 correlates with insulin resistance in many people, though this varies meaningfully by race and sex, so treat it as supporting evidence, not a standalone diagnosis.
QUICKI is another calculated index, less commonly used clinically than HOMA-IR but occasionally referenced in research comparing sensitivity measures.
Combined insulin + C-peptide panels give you the clearest overall picture, since pairing the two markers helps separate pancreatic hypersecretion from other explanations for elevated insulin.
Pro Tip: If your insurance won’t cover fasting insulin as a standalone test, ask whether it’s bundled into a broader metabolic panel. Bundled ordering is often cheaper than requesting it individually, and it’s how Healthspan Holistic structures its own lab options.
A1C, FPG, and lipid panels are typically covered by insurance as part of routine screening. Fasting insulin, C-peptide, and OGTT-with-insulin are covered inconsistently and often depend on documented risk factors, which is why many people order them directly through a lab panel instead of waiting on prior authorization.
How to Interpret Your Insulin Resistance Test Results
Numbers without context are just numbers, so here’s what the thresholds actually mean.
For HOMA-IR, there’s no single universally agreed cutoff. Many U.S. clinical and research settings treat values between roughly 2.0 and 3.0 as indicating insulin resistance, with some NHANES analyses using 2.5 as the marker. Values under 1.0 are generally considered optimal, and results in the 1.5 to 1.9 range often get flagged as borderline, worth monitoring rather than treating aggressively. Your specific lab’s reference range matters more than any number you find online, since assay methods for insulin vary between labs.
A1C and FPG have firmer, more standardized cutoffs used clinically to identify prediabetes and diabetes. These thresholds capture glucose control, not insulin output, which is exactly why someone can have a normal A1C and still be significantly insulin resistant.
TG/HDL ratio guidance runs looser: above 3.0 raises suspicion in many populations, but this marker shifts by ethnicity and sex, so it works best as a supporting signal alongside insulin and glucose values, not a replacement for them.
| Marker | What it captures | Typical unit | Quick interpretation |
|---|---|---|---|
| Fasting insulin | Pancreatic insulin output at rest | μU/mL | High with normal glucose suggests early compensation |
| HOMA-IR | Calculated insulin resistance estimate | Ratio (unitless) | Below 1.0 optimal; 2.0-3.0+ often flagged as resistant |
| A1C | Average glucose, 3-month window | Percent (%) | 5.7-6.4% prediabetes; 6.5%+ diabetes |
| C-peptide | Endogenous insulin production | ng/mL | Distinguishes pancreatic output from injected insulin |
| TG/HDL ratio | Lipid-based resistance surrogate | Ratio (unitless) | Above 3.0 suggestive, varies by population |
One important caveat: HOMA-IR is calculated from fasting values, which means it reflects hepatic (liver) insulin sensitivity more than muscle sensitivity. A normal HOMA-IR doesn’t rule out insulin resistance in muscle tissue, especially if you have central obesity or skin changes like acanthosis nigricans. There’s also no single validated treatment algorithm built purely on a HOMA-IR score; it’s a flag that prompts further conversation, not a diagnosis by itself.
Who Should Get Tested and When
Testing tends to make the most sense when specific risk factors are present rather than as a routine screen for everyone.
- Being overweight, particularly with central (abdominal) fat distribution
- A family history of type 2 diabetes
- A personal history of gestational diabetes
- High blood pressure or abnormal cholesterol and triglyceride levels
- Acanthosis nigricans (darkened, velvety skin patches, often at the neck or armpits)
- A normal A1C despite strong clinical suspicion of metabolic dysfunction
Major screening guidance from the NIDDK and CDC still centers on glucose-based tests as the front line, with insulin-focused testing added at a clinician’s discretion rather than mandated for everyone. If your results come back borderline, a reasonable approach is to make targeted lifestyle changes, then retest fasting insulin and glucose in 8 to 12 weeks to see whether the trend is improving.
Pro Tip: Don’t wait for a single “bad” number to panic, and don’t dismiss a single “good” one either. Insulin resistance develops over years, so trend lines from repeat testing tell you far more than any one draw.
How to Get Tested and What Comes Next
You have two practical routes: go through your primary care provider or an endocrinologist, or order a direct lab panel yourself.
| Route | Access speed | Interpretation support | Typical cost path |
|---|---|---|---|
| Primary care or endocrinologist | Depends on appointment availability | Built-in clinician review | Often insurance-covered for glucose/A1C; insulin varies |
| Direct-to-consumer lab panel | Usually fast, self-scheduled | Varies by provider; some include coaching | Typically out-of-pocket, transparent pricing upfront |
Before your draw, run through this short checklist:
- Confirm your fasting window (8 to 12 hours, water only).
- Note any medications, especially anything affecting blood sugar, and tell your provider.
- Schedule morning draws when possible, since insulin and glucose fluctuate throughout the day.
If your results come back abnormal, the next moves are straightforward: tighten up nutrition and activity patterns (a protein-first approach tends to help insulin sensitivity specifically), retest in 8 to 12 weeks, and escalate to medication or specialist referral if numbers aren’t trending in the right direction. For people already dealing with significant metabolic risk, it’s worth understanding the benefits and risks of GLP-1 medications as part of that conversation with a provider. Healthspan Holistic’s Metabolic Panel and Peptide Baseline Lab Panel are both built to cover this exact use case, giving you fasting glucose, insulin-relevant markers, and follow-up support without waiting on a referral.
Research Context: The Clamp, Surrogate Indices, and Their Limits
The hyperinsulinemic-euglycemic clamp works by infusing insulin at a fixed rate while adjusting glucose infusion to hold blood sugar steady, then measuring how much glucose is needed. More glucose needed means better insulin sensitivity. It’s the reference standard because it isolates insulin action directly, without relying on the body’s own feedback loops.
Surrogate indices like HOMA-IR, QUICKI, the Matsuda Index, and the McAuley Index approximate clamp results using far simpler blood draws, and they’re validated against clamp data with varying degrees of correlation. None matches the clamp’s precision. All of them trade some accuracy for the practicality of a single draw instead of a multi-hour procedure, which is exactly why they dominate real-world clinical use despite their imperfections.
An Editorial Note on Testing and Interpretation
If I had to pick one change to routine lab work, it would be adding fasting insulin by default instead of leaving it as an opt-in request. Most people never think to ask for it, and it’s the single test most likely to catch trouble before A1C does.
C-peptide earns its place when insulin numbers alone don’t tell a clean story, particularly for anyone with a confusing family history or unclear pancreatic function. In practice, lab numbers mean the most when they’re read alongside how someone actually lives: sleep, movement, wearable trends, food patterns. That’s the model Healthspan Holistic’s coaching is built around, and it’s worth knowing before you order anything.
Order the Right Panel Without Guessing What to Ask For
Getting fasting insulin added to routine labs usually means specifically requesting it, and plenty of people never get around to it. Healthspan Holistic built its lab options around that exact gap: the Metabolic Panel covers glucose, lipids, and other core metabolic markers as an accessible starting point, while the Peptide Baseline Lab Panel goes deeper into markers relevant to insulin and peptide activity for anyone who wants a fuller picture of pancreatic function and metabolic risk.
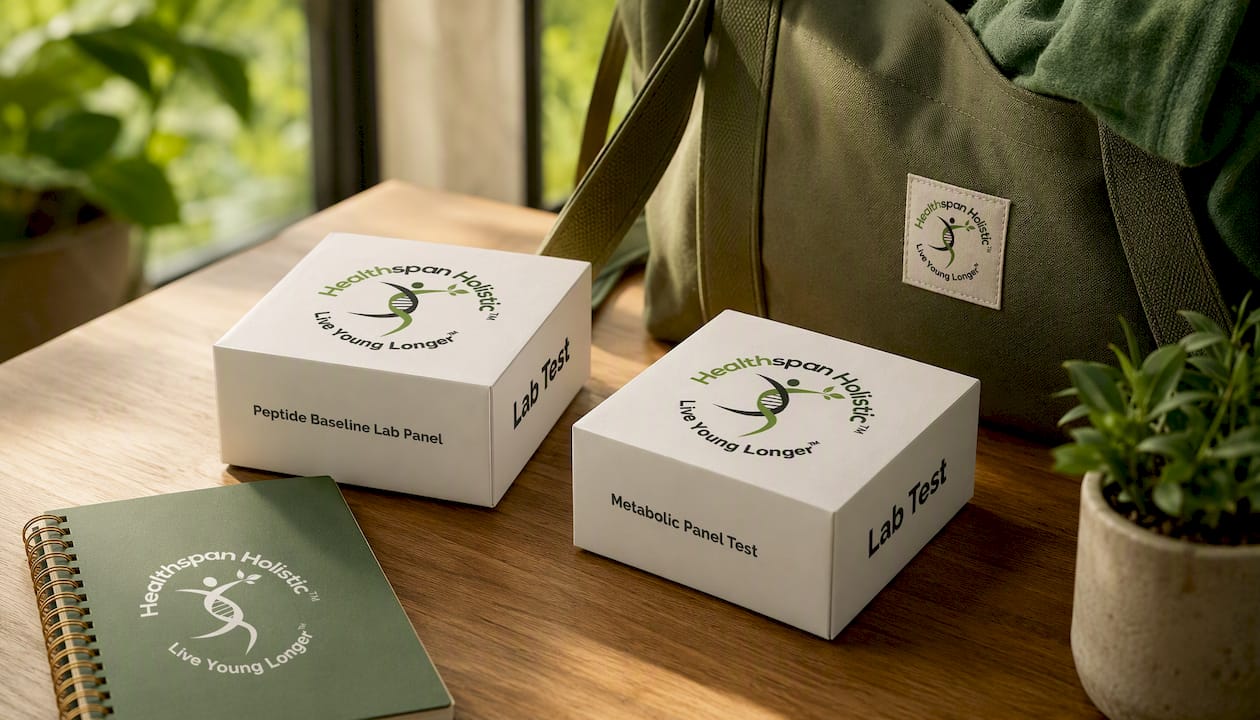
Both panels come with the interpretation support that a raw lab printout doesn’t give you: a health coach who can walk you through what your HOMA-IR calculation actually means for your specific situation, and how it connects to your sleep, nutrition, and activity data.
If your results come back showing early insulin resistance, Healthspan Holistic’s online store also carries professional-grade supplements targeting metabolic and cardiovascular health, so you’re not left with a number and no next step. Order your panel today and get your results paired with a coaching conversation, not just a PDF.
Sources
For readers who want to go deeper into the research and guidelines behind this article:
- PMC article on insulin resistance measurement
- HOMA-IR calculator — MDCalc
- C‑peptide test — MedlinePlus
- Insulin resistance & prediabetes — NIDDK
Share your results with a clinician or health coach rather than interpreting a single number in isolation, and consider ordering through Healthspan Holistic’s lab panels if you want testing bundled with coaching support.
This article is general information, not a substitute for advice from a qualified doctor. Consult a qualified healthcare professional about your own circumstances before acting on anything here.
FAQ
What Are the Signs of Insulin Resistance?
Common signs include fatigue after meals, weight gain around the midsection, sugar cravings, skin changes like acanthosis nigricans, elevated blood pressure, and abnormal triglyceride or HDL levels, though many people have no obvious symptoms at all.
Can You Reverse Insulin Resistance?
Insulin resistance often improves significantly with sustained changes to diet, physical activity, and sleep, and many people see measurable improvement in fasting insulin and HOMA-IR scores within weeks of consistent changes.

How Do You Check Your Insulin Resistance Levels?
The most direct way is a fasting insulin and fasting glucose blood draw used to calculate HOMA-IR, ordered through your clinician or through a lab panel like Healthspan Holistic’s Metabolic Panel.
Is a HOMA-IR Score Enough on Its Own?
No single HOMA-IR score should be treated as a diagnosis; it works best as an early flag combined with A1C, lipid markers, and clinical signs, tracked over time rather than judged from one draw.
Leave a comment: