

Wearable health data is the continuous stream of physiologic and behavioral signals your devices capture around the clock: heart rate, sleep stages, heart rate variability (HRV), blood oxygen saturation (SpO2), skin temperature, step count, and, for some users, real-time glucose. The single most effective thing you can do with it right now is export a 30-day trend for two to four of your most relevant metrics and compare it against a blood panel or clinical baseline.
Three metrics with the strongest evidence for meaningful health decisions:
-
Resting heart rate and HRV for cardiovascular and recovery status
-
Sleep duration and efficiency for metabolic, cognitive, and hormonal health
-
Daily step count or physical activity energy expenditure (PAEE) for all-cause mortality risk reduction
Your 24-hour action: open your device’s companion app, export a two-week summary (most apps offer a PDF or CSV option), note any obvious trend shifts, and send or bring it to your next clinician visit.
Key Takeaways
Wearable health data becomes clinically meaningful only when persistent trends are paired with targeted lab testing and interpreted within your personal baseline, not read as isolated daily numbers.
| Point | Details |
|---|---|
| Prioritize validated metrics | Resting HR, HRV, sleep efficiency, and step count have the strongest outcome evidence for personal health decisions. |
| Export and annotate regularly | A 30-day annotated summary with noted confounders is far more useful to a clinician than raw data. |
| Pair trends with labs | Wearables screen and monitor; blood panels diagnose. Use both together for high-confidence decisions. |
| Know the accuracy limits | Consumer wearables are not FDA-approved diagnostic tools; confirm actionable signals with clinical tests. |
| Healthspan Holistic integration | The 90 Day Journey to Longevity combines wearable review, advanced lab panels, and personalized coaching into one structured program. |
What does wearable health data actually measure?
Modern wearables pack several sensors into a surprisingly small form factor, and each sensor feeds a different category of health signal.
The sensors behind the numbers
Photoplethysmography (PPG) is the green or red light sensor on the back of most wrist wearables and finger rings. It detects blood volume changes in capillaries to derive heart rate, HRV, SpO2, and, in some devices, respiratory rate. Accelerometers and gyroscopes translate movement into step counts, activity intensity, sleep staging, and fall detection. Skin temperature sensors track circadian temperature rhythms and can flag illness or ovulation shifts. Electrocardiogram (ECG) electrodes, available on select smartwatches, capture single-lead electrical heart signals useful for detecting atrial fibrillation (AFib). Continuous glucose monitors (CGMs) use a subcutaneous filament to measure interstitial glucose every one to five minutes, giving a real-time metabolic picture that no wrist sensor can replicate.
Which metrics have the strongest evidence
Not every number your device produces carries equal clinical weight. Steps and PAEE have the most robust outcome data: Meta-analyses show that activity trackers are associated with increased daily step counts and modest weight loss. Resting heart rate and HRV have well-established links to autonomic nervous system health and recovery. Sleep duration and efficiency are validated proxies for metabolic and cognitive function. CGM-derived glucose variability is a strong metabolic signal, especially when paired with fasting glucose and HbA1c from a lab.
Signal-to-goal mapping
| Goal | Primary metric | Secondary metric |
|---|---|---|
| Sleep improvement | Sleep efficiency, duration | Resting HR, HRV overnight |
| Fitness and activity | Daily steps, PAEE | Resting HR trend |
| Metabolic health | CGM glucose variability | Step count, sleep efficiency |
| Cardiovascular monitoring | Resting HR, ECG rhythm | HRV, SpO2 |
Pro Tip: Ring-form sensors (like Oura) tend to produce more stable overnight HRV readings than wrist sensors because the finger has less motion artifact during sleep. If sleep and recovery are your primary goals, a ring may give you cleaner data than a watch.
How do you collect, export, and consolidate your wearable data?
Getting data off your device and into a usable format is simpler than most people expect, but a few steps done in the wrong order create gaps that are hard to fix later.
Step-by-step collection checklist
-
Enable cloud sync on your device. Open the companion app (Garmin Connect, Fitbit app, Apple Health, Samsung Health, Oura app) and confirm automatic background sync is active. Without this, gaps appear whenever your phone is out of range.
-
Connect to Apple HealthKit or Google Fit. Both platforms act as a central aggregator. On iOS, go to Settings → Privacy → Health → Apps and grant read/write access to each wearable app. On Android, open Google Fit or Health Connect and authorize each app. This consolidates multi-device data into one timeline.
-
Export via the vendor’s native tool. Most platforms offer a data export in the app settings or via a web portal. Apple Health exports a ZIP file containing XML and CSV files. Fitbit’s web dashboard exports CSV by date range. Garmin Connect exports FIT files or CSV summaries. Oura’s web app exports CSV.
-
Use third-party integrators when needed. Tools like Apple’s Shortcuts, Google Takeout, or open-source libraries (e.g., the Python
fitparselibrary for Garmin FIT files) let you pull data into spreadsheets or analysis tools. For clinical sharing, platforms like Terra API or Validic aggregate multi-device streams into a single normalized feed. -
Apply basic data hygiene before analysis. Align timestamps to a single time zone, remove duplicate records when two devices overlap (keep the higher-resolution source), and flag days with fewer than 20 hours of wear as incomplete.
Pro Tip: Export daily summary data first. Event-level data (every heartbeat, every step) produces files that are gigabytes in size and rarely needed for personal trend analysis. Pull granular data only when investigating a specific anomaly, like an unusual HRV spike on a particular night.
Common roadblocks and quick fixes
-
Missing days: Usually caused by a failed sync. Force a manual sync in the app and check that Bluetooth was active.
-
Multi-device duplicates: Apple Health’s deduplication logic sometimes keeps both sources. In the Health app, go to each data type → Data Sources and drag your preferred device to the top.
-
Time zone mismatches after travel: Manually tag travel dates in your export notes so you don’t misread a circadian shift as a health change.
Wearable data exports are only as useful as the context around them. A two-week annotated timeline, with notes on illness, travel, and major stressors, turns a raw CSV into something a clinician can actually use. For practical at-home monitoring guidance that complements this workflow, at-home health monitoring tips offer a useful companion reference.
What are the accuracy limits of consumer wearables?
Consumer wearables are not clinical instruments, and treating them as such is one of the most common mistakes health-conscious adults make. ECRI explicitly warns that most consumer wearables lack FDA diagnostic approval, have variable accuracy, and offer inconsistent privacy protections. Their best current role is trend monitoring and prompting targeted clinical follow-up, not diagnosis.
Where errors come from
Sensor placement and motion artifacts are the biggest sources of noise in PPG-based metrics. A loose wristband during exercise can inflate or suppress heart rate readings by 10–20 beats per minute. Skin tone and physiology affect PPG accuracy: darker skin tones absorb more light at the wavelengths most PPG sensors use, which can reduce SpO2 accuracy. Multiple independent studies have flagged this as a persistent gap in device validation. Algorithmic smoothing is a subtler problem: most devices apply proprietary filters to raw sensor data before displaying a number, which means you are reading a processed estimate, not a direct measurement. The algorithm’s assumptions may not match your physiology.
Sampling frequency changes what you can infer. A device that samples heart rate every 5 minutes will miss short arrhythmia episodes that a continuous ECG would catch. Daily step summaries hide sedentary bout patterns that matter for metabolic health. Fred Hutch researchers note that converting raw, high-frequency signals into reliable clinical insights requires reproducible statistical workflows, not just raw exports.
Common device errors to watch for
-
SpO2 readings below 90% at rest in a healthy adult without symptoms: likely a sensor placement or motion artifact, not true hypoxia. Retest with the device snug and your hand still.
-
HRV values that jump 50% overnight without illness or travel: often caused by a loose sensor or a night where the device slipped.
-
Step counts that are wildly high on days you barely moved: accelerometer misclassification of repetitive hand motions (typing, cooking) as steps.
-
Sleep staging errors: consumer sleep staging has moderate accuracy for distinguishing light from deep sleep and is weakest at identifying REM. Treat sleep stage proportions as rough guides, not clinical data.
Pro Tip: When a reading looks suspicious, cross-check it with a validated reference. For heart rate, a 60-second manual pulse count at the wrist or neck is your gold standard. For SpO2, a $25 pulse oximeter from a pharmacy gives a more reliable spot check than most wrist sensors.
A review of wearable device challenges identifies data quality, interoperability, and equity as the three core problems the field has not yet solved at scale. Knowing these limits does not mean ignoring your data. It means reading trends over weeks, not individual readings on a single morning.
How do you interpret wearable signals without overreacting?
A single anomalous reading is almost never meaningful. A trend that persists for five or more days usually is.
Build your personal baseline first
Spend the first two to four weeks of wearing a new device doing nothing except collecting data under your normal conditions. That baseline is your reference point. A resting heart rate of 62 bpm means nothing in isolation; a resting heart rate that climbs from 62 to 71 bpm over three weeks, without a change in fitness routine, is a signal worth investigating.
Rolling seven-day averages smooth out daily noise and make trends visible. Most companion apps calculate these automatically. For HRV, a drop of more than 20% from your personal rolling average, sustained over three or more days, typically indicates physiologic stress worth addressing, whether from overtraining, illness, or poor sleep.
Confounders that change every metric
-
Illness and infection: Resting HR rises and HRV drops before you feel sick, sometimes by 24–48 hours. This is one of the most clinically useful early-warning signals wearables provide.
-
Travel and time zone shifts: Circadian disruption alters sleep staging, temperature rhythms, and HRV for two to five days after a long flight. Tag travel in your notes before drawing conclusions.
-
Caffeine and alcohol: Both suppress HRV and fragment sleep architecture. A single evening of alcohol can reduce sleep efficiency by 10–20 percentage points on your device.
-
Medication changes: Beta-blockers lower resting heart rate and blunt HRV. Starting or stopping any medication that affects the autonomic nervous system will shift your baseline.
-
Sensor misplacement: A watch worn too loosely during sleep produces unreliable overnight data. Check fit before bed.
When to act on a signal
The translation from signal to action follows a simple hierarchy: self-adjustment first, then lab testing, then clinical referral.
-
Lower sleep efficiency (below 80% for more than a week): Start with sleep hygiene (consistent wake time, cooler room, no screens 60 minutes before bed). If it persists beyond two weeks, keep a sleep diary for seven days. If it persists beyond four weeks, discuss with a clinician and consider a sleep study.
-
Resting HR elevated 10+ bpm above baseline for more than five days: Rule out illness, dehydration, and overtraining. If none apply, pair with a metabolic and thyroid panel.
-
New AFib alert on an ECG-capable watch: Do not dismiss it. Record a second ECG reading within the hour. If the alert repeats, contact your clinician the same day. ECRI guidance is explicit: confirm any actionable wearable signal with a clinical assessment before changing care.
-
SpO2 consistently below 94% at rest: Seek same-day clinical evaluation.
How do you combine wearable data with lab tests and clinical care?
Wearables are screening and monitoring tools. Labs are diagnostic anchors. The two work best together, not as substitutes for each other.
A wearable trend that shows rising resting heart rate, declining HRV, and worsening sleep efficiency over six weeks tells you something is changing. It does not tell you whether the driver is thyroid dysfunction, anemia, cortisol dysregulation, or simple overtraining. A targeted blood panel answers that question. Blood testing for wellness and longevity explains why pairing these two data streams produces far more actionable information than either alone.
Workflow for pairing wearable trends with labs
-
Identify the persistent trend. A signal that has lasted at least two weeks and cannot be explained by a known confounder (travel, illness, medication change) is worth investigating.
-
Select the relevant lab panel. Rising resting HR and fatigue → metabolic panel, thyroid (TSH, free T3, free T4), CBC. Poor sleep and low HRV → cortisol, sex hormones (testosterone, estradiol, DHEA-S), thyroid. Glucose variability on CGM → fasting glucose, HbA1c, fasting insulin, lipid panel.
-
Export a summary for your clinician. A two-page summary is more useful than a raw data dump. Include: the metric, the date range, your baseline value, the current value, and any notable events (illness, travel, new medication).
-
Annotate the timeline. Mark the date the trend started, any life events that coincide, and what you have already tried.
-
Attend the appointment with a short verbal summary. “My resting heart rate has been 10 beats above my normal for three weeks, my HRV is down 25%, and my sleep efficiency dropped from 84% to 71%. I’ve ruled out illness and travel.” That framing takes 20 seconds and gives a clinician exactly what they need.
What clinicians find useful vs. noise
Clinicians generally find high-level trends, annotated event examples, and clear timeframes useful. Raw second-by-second data, unlabeled CSV files, and screenshots of individual readings are noise. Wearable integration in clinical workflows remains an active challenge: most electronic health record systems do not yet have a standardized intake pathway for patient-supplied wearable data, so a well-prepared summary is your best tool.
Clinician summary template
| Field | What to include |
|---|---|
| Device and app | Device name, app version, wear period |
| Metrics tracked | List each metric with units |
| Baseline values | Your personal 30-day average before the trend |
| Current values | Average over the past 7 days |
| Notable events | Illness, travel, medication changes, major stressors |
| Suspected confounders | What you have already ruled out |
| Question for clinician | One specific question you want answered |
For a deeper look at which lab tests support preventive care at each stage of life, the Healthspan Holistic blog covers the specific panels most relevant to adults over 40.
Why do interoperability standards matter for your data?
The technical standards governing how health data moves between systems directly affect your ability to share, store, and reuse what your wearable collects.
FHIR (Fast Healthcare Interoperability Resources) is the current gold standard for health data exchange. Developed by Health Level 7 (HL7), FHIR defines a common language for representing health records as structured data objects that different systems can read and write. When your hospital’s electronic health record supports FHIR, it can, in principle, receive a structured export from a wearable platform that also speaks FHIR, without manual reformatting.
Open mHealth is a set of schemas and APIs specifically designed for mobile and wearable data. It defines standard data formats for common metrics like step count, heart rate, and sleep duration, so that data from different devices can be compared and combined without custom translation work.
Health Level 7 (HL7) is the parent standards organization behind FHIR and several older messaging standards (HL7 v2, CDA) still used in hospital systems. Understanding that FHIR is the modern, web-friendly evolution of HL7 messaging helps you ask the right questions when evaluating a platform.
What this means practically
-
Before buying a device or app, check whether it supports HealthKit, Google Health Connect, or FHIR export. These are the three most common pathways into clinical systems.
-
Ask your health system whether their patient portal accepts FHIR-based data imports. Many Epic and Cerner installations now support Apple Health integration via FHIR.
-
Check the platform’s data access policy for API availability, export limits (some platforms cap historical exports), and whether you can download your full raw data if you cancel your subscription.
Practical steps for checking interoperability before purchase:
-
Search the device manufacturer’s support pages for “data export” and “API.”
-
Look for HealthKit or Google Health Connect integration in the app store listing.
-
Check whether the platform has a published developer API and whether it is free or requires a paid tier.
-
Confirm that historical data is exportable, not just current-day summaries.
Does HIPAA apply to your wearable data?
The short answer: usually not, unless your wearable data flows through a covered healthcare entity.
HIPAA (the Health Insurance Portability and Accountability Act) applies to covered entities, which are healthcare providers, health plans, and healthcare clearinghouses, and their business associates. A consumer wearable company like Fitbit, Garmin, or Apple is not a covered entity when it sells you a device directly. That means the data on their servers is governed by their own privacy policy, not HIPAA.
HIPAA does apply when a clinician orders a wearable as part of your care, when data flows into a covered entity’s system (your hospital’s EHR), or when a health plan uses wearable data in coverage decisions. In those cases, the covered entity’s HIPAA obligations extend to the data.
ECRI’s guidance on wearable data notes that organizations using commercial wearable data in clinical care should develop explicit policies and consult legal counsel, because liability questions are not yet fully settled.
Privacy checklist before sharing wearable data
-
Read the vendor’s privacy policy before connecting a third-party app. Look specifically for clauses about selling or sharing de-identified data with research partners.
-
Use the minimum necessary data principle. Share only the metrics relevant to the clinical question, not your full raw export.
-
Prefer encrypted transfer. When sharing with a clinician, use a patient portal or secure messaging rather than email.
-
Understand retention policies. Some platforms retain your data indefinitely after account deletion unless you explicitly request erasure.
-
Anonymize when possible before sharing with research programs or wellness apps that are not covered entities.
-
For organizational use, consult legal counsel before integrating employee wearable data into any health or benefits program. The legal and ethical boundaries here are still evolving.
One practical rule: if you would not hand a stranger a printed copy of the data, do not share it through an app whose privacy policy you have not read.
What are the most effective use cases for wearable data?
Four goals account for the majority of meaningful wearable-driven health improvements: better sleep, more daily movement, metabolic control, and cardiovascular monitoring.
Sleep improvement
Track sleep efficiency and total sleep duration as your primary metrics. A consistent wake time is the single most evidence-supported behavioral lever for improving sleep quality. If efficiency stays low after two weeks of consistent timing, add a sleep diary to capture what the wearable cannot (anxiety, noise, pain). Persistent poor sleep warrants a cortisol and sex hormone panel, since both are common drivers in adults over 40.
Increasing daily activity
Meta-analyses of activity tracker interventions show that users wearing trackers take roughly 1,800 more steps per day than controls, with associated improvements in body weight. The mechanism is simple: seeing the number creates a feedback loop. Set a daily step goal 10–15% above your current average, not an arbitrary 10,000. Review your weekly average every Sunday and adjust the goal upward when you hit it consistently for two weeks.

Metabolic control with CGM
A CGM worn for two weeks gives you a glucose variability profile that a single fasting glucose test cannot. Look for post-meal spikes above 140 mg/dL and the time it takes glucose to return to baseline. Meals that spike you consistently are candidates for portion adjustment or macronutrient rebalancing. Pair your CGM data with a fasting insulin and HbA1c test to confirm whether variability reflects true insulin resistance or is diet-driven and reversible.
Cardiovascular monitoring
| Metric | Signal to watch | Meaningful change | Next action |
|---|---|---|---|
| Resting HR | 7-day rolling average | Rise of 10+ bpm from baseline | Rule out illness; order metabolic/thyroid panel |
| HRV | 7-day rolling average | Drop of 20%+ from baseline | Reduce training load; assess sleep and stress |
| ECG rhythm | AFib alert | Any confirmed alert | Same-day clinician contact |
| SpO2 | Overnight average | Consistently below 94% | Same-day clinical evaluation |
Monitoring schedule: Review your 7-day rolling averages once a week. Export a 30-day summary monthly. If a trend persists for two weeks, order a relevant lab test. If it persists for four weeks with no clear explanation, book a clinician visit.
How do you choose a device and set it up for accurate data?
The best wearable is the one you will wear consistently, but accuracy and data access matter too.
Selection checklist
-
Metrics tracked: Confirm the device measures the specific metrics relevant to your goals. Not all wearables include ECG, skin temperature, or SpO2.
-
Clinical validation evidence: Look for published validation studies, not just marketing claims. Devices with peer-reviewed accuracy data for the metrics you care about are preferable.
-
Data access and export: Check for HealthKit/Google Health Connect integration, CSV export, and API availability before purchase.
-
Battery life and wearability: A device you take off every night to charge will miss your most valuable data window (sleep). Devices with five or more days of battery life are easier to wear consistently.
-
Price and subscription model: Some platforms charge a monthly fee for full data access. Factor that into the total cost.
Setup tips that actually improve accuracy
-
Wear the device snug, two finger-widths above the wrist bone. Too loose and PPG signal quality drops significantly.
-
Update firmware before your first full data collection week. Manufacturers regularly push algorithm improvements that change baseline readings.
-
Wear consistently. A device worn only during workouts produces a biased dataset. Aim for 22 or more hours of wear per day.
-
Calibrate step counting by walking a known distance (a measured 100-meter stretch) and comparing the device count to your actual steps. Most devices are within 5–10% on flat ground.
-
Set your profile data accurately (height, weight, age, biological sex). These inputs feed the algorithms that estimate calorie burn, VO2 max, and sleep staging.
Pro Tip: If you use two devices simultaneously (a smartwatch and a CGM, for example), wear them on opposite arms to reduce cross-device interference and make it easier to attribute readings to the correct sensor during export.
Battery life vs. sampling frequency trade-off
Higher sampling frequency (continuous heart rate every second vs. every 5 minutes) produces richer data but drains battery faster. For most personal health goals, a 1-minute sampling interval is a reasonable compromise. Reserve continuous sampling for specific monitoring windows, like a 24-hour HRV assessment or a post-exercise recovery period.
Who do wearables work well for, and when do they fall short?
Wearables were largely validated in young, healthy, light-skinned adults, and that matters for how you interpret your results.
Known bias sources
- Skin tone and PPG accuracy: — Multiple studies have documented that darker skin tones reduce the accuracy of PPG-based SpO2 and heart rate readings, particularly during exercise. The NCBI review on wearable challenges identifies this as a core equity gap.
Access and affordability
A quality wearable with clinical-grade features costs $200–$500, plus potential subscription fees. That price point excludes a significant portion of the population who would benefit most from continuous monitoring. Pragmatic workarounds include short-term CGM use (two weeks of data is often enough to identify key patterns), borrowing a device from a clinician or wellness program for a targeted monitoring period, or using a lower-cost device for step count and sleep duration only, which are the two metrics with the most robust outcome evidence.
Pro Tip: To quickly assess whether a device is likely valid for your physiology, compare its resting heart rate reading against a 60-second manual pulse count three times on different days. If the device is within 5 bpm of your manual count consistently, its PPG signal quality is probably adequate for trend monitoring.
When to prioritize clinical testing instead
If you fall outside the typical validation cohort (older adult, darker skin tone, significant comorbidities), treat your wearable data as directional rather than precise. Use it to identify patterns worth investigating, then confirm with clinical-grade tests. A 24-hour Holter monitor gives far more reliable arrhythmia data than a consumer ECG watch. A lab glucose tolerance test is more diagnostically reliable than two weeks of CGM data alone.
How Healthspan Holistic integrates wearable data with labs and coaching
The real power of wearable health data emerges when you connect it to targeted lab testing and personalized coaching. Here is how that workflow looks in practice.
The integrated workflow
-
Collect two to four weeks of wearable data across your priority metrics (resting HR, HRV, sleep efficiency, step count, and CGM glucose if relevant).
-
Identify a persistent trend that has lasted at least two weeks and cannot be explained by a known confounder.
-
Order a targeted lab panel matched to the trend. Rising resting HR and poor sleep → metabolic panel, thyroid, and hormone panel. Glucose variability → fasting insulin, HbA1c, lipid panel.
-
Review results with a coach or clinician who can contextualize both the wearable trend and the lab values together.
-
Build a personalized plan covering nutrition adjustments, sleep protocol, targeted supplementation, and a follow-up monitoring schedule.
-
Re-assess at 30 and 90 days using the same wearable metrics and a repeat of the relevant labs.
A concrete example
Suppose your wearable shows nocturnal heart rate rising from a baseline of 54 bpm to 63 bpm over six weeks, with sleep efficiency dropping from 83% to 69% and HRV declining 30% from your rolling average. No illness, no travel, no new medications. That pattern is consistent with thyroid dysfunction, cortisol dysregulation, or early hormonal decline, all of which are common in adults over 40 and all of which are invisible to a wearable alone.

A comprehensive hormone panel and a metabolic panel ordered at that point give you the diagnostic anchors to understand what is driving the wearable signal. A coaching session then translates those results into a specific plan: adjusted sleep timing, targeted supplements (magnesium glycinate for sleep, adaptogens for cortisol, or hormone support as indicated), and a 90-day re-assessment.
For adults interested in going deeper on how genetic data can add another layer to this picture, genetic testing for longevity explains how DNA-level insights complement wearable and lab findings.
Pro Tip: When preparing for your first integrated coaching session, bring three things: your 30-day wearable export, your most recent lab results (even if from a different provider), and a one-paragraph note on your top two health goals. That preparation cuts the diagnostic conversation time in half and gets you to an action plan faster.
How Healthspan Holistic can help you go further
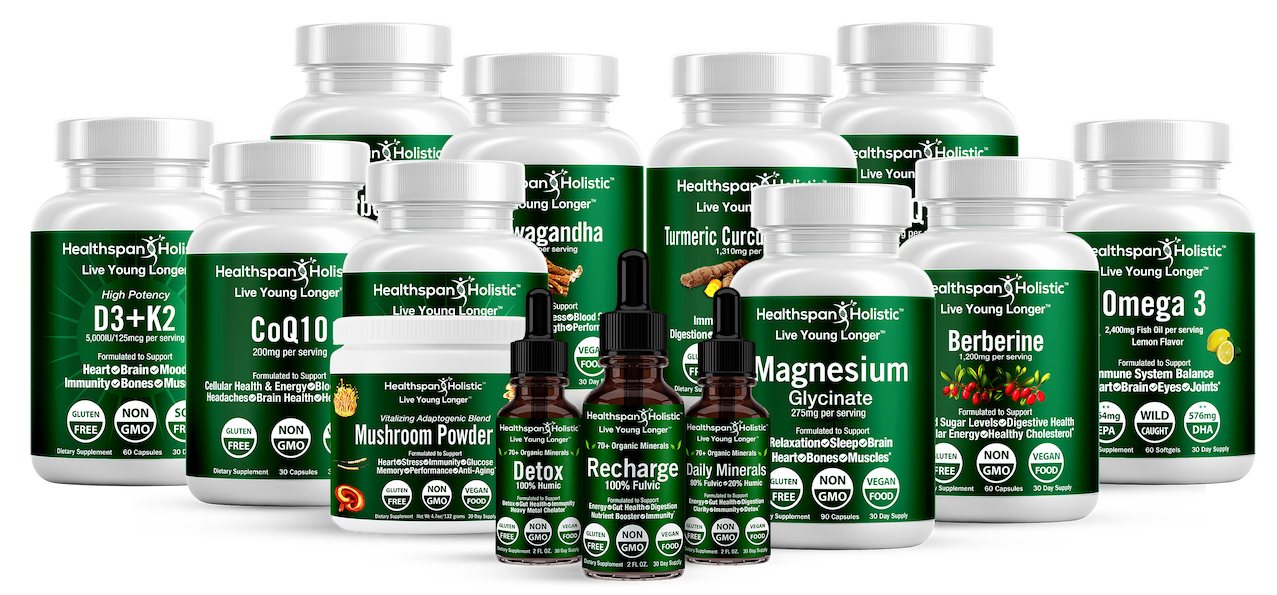
Wearable trends tell you something is shifting. Labs tell you why. Coaching tells you what to do about it. Healthspan Holistic combines all three in one integrated program built specifically for adults over 40 who want measurable results, not generic advice.
The 90 Day Journey to Longevity pairs advanced blood panels (metabolic, hormone, and thyroid) with AI-assisted wearable data review and one-on-one coaching to build a personalized plan around your actual numbers. You bring your wearable export and your health goals. The team brings the diagnostic framework, the clinical context, and the supplement and lifestyle protocol tailored to what your data shows.
A perspective worth sharing
The most underappreciated truth about wearable health data is that the device is not the intervention. The data is only as useful as the framework you bring to it.
Most people collect months of heart rate and sleep data and do nothing with it because the numbers feel abstract without a reference point. The reference point is your personal baseline, and the baseline only becomes meaningful when you have something to compare it against: a lab result, a coaching conversation, a structured 90-day protocol with defined re-assessment points.
What I find most compelling about the current state of wearable technology is not the sensors themselves, which are genuinely impressive, but the emerging analytic layer on top of them. Research like the PHIA study in Nature Communications shows that agentic AI systems can now answer longitudinal questions from wearable data (“Do I sleep better after strength training?”) with a level of accuracy that was not possible even two years ago. That capability, combined with targeted lab testing and personalized coaching, is what turns a fitness tracker into a genuine health tool.
The adults who get the most from wearable monitoring are not the ones with the most expensive devices. They are the ones who export their data, pair it with a blood panel, and sit down with someone who can help them read both together. That combination, wearable trends plus labs plus coaching, is the approach that produces measurable, lasting change.
This article is general information, not a substitute for advice from a qualified doctor. Consult a qualified healthcare professional about your own circumstances before acting on anything here.
Sources
The sources below represent the strongest available evidence and guidance on wearable health data collection, interpretation, and clinical integration.
FAQ
What is wearable health data?
Wearable health data is the continuous stream of physiologic and behavioral signals captured by body-worn sensors, including heart rate, HRV, sleep stages, SpO2, step count, skin temperature, and glucose. These signals are most useful for trend monitoring and prompting targeted clinical follow-up.
Do cardiologists recommend smartwatches?
Many cardiologists find consumer smartwatches useful for detecting potential AFib alerts and tracking resting heart rate trends, but they consistently recommend confirming any alert with a clinical ECG before changing treatment. ECRI guidance reinforces that consumer devices lack FDA diagnostic approval and should not replace clinical assessment.
How do you get data out of a wearable device?
Most devices export data through their companion app or web portal as CSV or XML files. Apple Health exports a full ZIP archive via Settings → Health → Export All Health Data. Fitbit and Garmin offer date-range CSV exports through their web dashboards. Third-party platforms like Terra API can aggregate multi-device streams into a single normalized feed.
Does HIPAA apply to consumer wearable data?
Generally no. Consumer wearable companies are not covered entities under HIPAA, so their data is governed by their own privacy policies, not federal health privacy law. HIPAA applies when wearable data flows into a covered healthcare entity’s system, such as a hospital EHR, or when a clinician orders the device as part of care.
What did RFK Jr. say about wearables?
Robert F. Kennedy Jr. has publicly expressed support for personal health monitoring technologies, including wearables, as part of a broader emphasis on preventive health and individual health data ownership. His comments have generally framed wearables as tools that empower individuals to take charge of their own health data, though specific policy positions on device regulation continue to evolve.
Leave a comment: